How to Analyze Trends
Analyzing trends can sometimes feel like a bit of a mystery. How deep should you dive? How many people should get involved? How do you know if you did a good job? When should you start it… and does it ever really end?
That’s why we thought it’d be useful to share with you our process for analyzing signals of change and provide you with some tips and tricks for getting the most out of your next session. If you stick to the end, you’ll even find a printable work sheet to help you log your trends into a handy dandy trends binder (if you like to keep things old school like that). If you’re more into digital tools you can definitely use this outline to set-up your own digital database or stay tuned for an upcoming post where we’ll reveal our preferred digital tool for digital trend management.
What is trend analysis?
To begin, let’s get on the same page about trend analysis. What in the world is it? Well, trend analysis is the process of critically assessing a documented pattern of change for future implications.
“It’s not about forecasting numbers, it’s about imagining possibilities.”
In other words it’s about examining a trend from multiple angles and trying to paint as vivid a picture as possible about the edges of possibility through analysis, discussion, and imagination. At the end of a well executed trend analysis session you should be left with a clear picture of which trends to include for additional foresight exercises, as well as a better understanding of trends’ opportunities and potential repercussions. Overall, trend analysis is less about trying to ‘predict’ the future of a trend, and more about thinking critically and imaginatively about its potential. For example, if we’re looking at ‘at home manufacturing’ as a trend, we’d be less interested in analyzing exactly how many 3D printers might be in use by 2040, and much more interested in analyzing what might happen when at home manufacturing becomes the norm.
Now, it’s important to note that trend analysis is different from identifying weak signals of change. If you’re not familiar with weak signals, they’re typically unique, fringe developments that don’t yet have a strong history of documentation but may be indicative of an emerging issue. Things like artistic and scientific experiments fall into this category.
So when should you do trend analysis? Well, first things first you’ll need to have yourself a handful of trends to analyze! That’s why this activity takes place after a horizon scanning exercise that identifies the various changes at play in the environment. Don’t know how to do a horizon scan? No worries! We’re in the process of writing you a guide which we’ll link here when available.
Getting started
Ok! So you’re ready to start analyzing your trends? Let’s start by setting the context and expectations for trend analysis, beginning with how much time you should dedicate to this activity. Of course, you can choose to spend as much or as little time as you’d like in this phase of your work, and choose to do trend analysis on a rolling basis or as a dedicated activity for a project.
If you’re doing your trend analysis alone (as you find and log trends) then you don’t really need to time box your sessions. Take however long it takes you to assess the trends. However, if you’re analyzing trends as a team for a specific project, we recommend trying to complete your dedicated trend analysis in a week or less. Now this time frame would be suitable for analyzing 15 or fewer trends as a remote group. By giving yourself a week to analyze trends you’re ensuring that you’re giving everyone enough time to dive into each trend and even revisit them if needed. You’re also allowing everyone enough time to build off of each others analyses and paint a more thorough picture of possibility. Sometimes giving yourself a little bit of time to familiarize yourself with the trends and let them mull in the background of your mind over the week can be an equally fruitful approach. You can’t always rush and force insights.
If you’re comfortable leading workshops you can complete trend analysis in a much shorter time frame by way of a group exercise: time box it to a half hour, or maybe an afternoon. Depending on how you structure your exercise, you could still end up with really deep analyses. In terms of logistics, we’ve found that analyzing trends in small teams of 3-5 works best. Of course you could have a much larger group, but separating larger groups into smaller working teams encourages engagement on behalf of everyone and ensures everyone’s thoughts are captured. It allows teams to bounce around analyzing other team’s analyses in iterative rounds of constructive feedback. This helps avoid group think and ensures everyone gets a chance to look at every trend.
Now that you have an understanding of the process - let’s get into the nitty gritty of trend analysis.

How to analyze trends
Enough with the groundwork. Let’s get started with analyzing trends! At Avenear, we like to give ourselves a standard table/format with which to assess trends. We find this makes it easier to compare and collect trends. Each template is divided it into four categories: the context, the impacts, the implications, and the speculations. Let’s go through it step by step.
1
What are we talking about
Start by setting the stage. This is kind of the boring part, but it’s necessary to explain the trend in the most basic way possible. What are we talking about? Give it a title, then write a couple of sentences to describe what it’s about. You don’t have to do any analysis at this point, simply document what you’re observing.
Descriptive title: Sure you can use puns and imaginative titles to capture your trends, but it may become harder to find that trend in your database if you can’t remember the exact title you gave it. We recommend sticking with good ol’ descriptive titles.
Keep it simple: Don’t go overboard with the description. Try to keep things simple, accessible, and digestible. Of course, you don’t want to omit anything important, but remember that you’re not writing an academic essay on the subject - you’re just trying to convey enough information to someone to fully understand the concept so they can participate in the analysis.
Drop the jargon: Try to explain everything in simple terms. This not only helps others understand the trend, but it also helps us think about it in a broader, more abstract way. This in turn can help us apply the trend to other industries, themes, or trends. A useful frame here is to imagine you’re trying to explain this to your parents or maybe your cousin who’s in a totally different field than you. How can you describe this trend in a way that they might understand it too?
Examples: Jot down whatever it is that can help “prove” that this trend really is a thing worth considering. Maybe it’s a list of a key companies playing in this field, some notable events or statistics that you’d want to jot down.
Label type: We find it useful to broadly categorize the trend into a “type.” We’re still playing around with this, but so far it’s proven useful. For example, note whether this trend is primarily a new type of production or manufacturing technique, a new process or system for accomplishing something, a physical product or thing to buy, a consumer behaviour or trait, a service or app, or a bigger, overarching enabler of change like a shift in demographics.
Draw it out: If you can, provide a sketch or find an image to represent the trend. Thinking visually can help you connect the dots in new ways.
2
Links to themes
This section is about identifying how the trend potentially links to other industries, themes, and categories. Thinking about the trend’s potential repercussions on different spheres of life starts to get us thinking about implications: what might need to happen in order for it to affect this industry?
Identifying links: Identify the themes and industries that it might most affect. Is this trend linked to the future of fashion? The food and beverage industry? Health? If you’re not sure, mark it anyways, you can always revisit it later.
Think in greys/gradients: Trend analysis is not a black and white exercise, instead it’s a walk in the grey. When identifying the relationship to various industries, we’ve found it useful to fill in a progress bar to indicate the strength of the relationship. Totally linked to art and culture? Fill in that bar to 100%. Only slightly linked to regulation? Fill it to the 25% mark. It doesn’t have to be exact. Just a gut feel will do! When working in groups, everyone will have their own take on just how related it is to different industries. This is your time to discuss each other’s perspectives.
Vary your mark making: If you’re using a checkbox to identify categories, you don’t have to limit yourself to checkmarks. Instead you can use small and large dots, dashes, or other marks to indicate the potential strength of relationship. If this trend heavily links to a particular category, fully ink in the box, if it’s just a whisper of a link then record your thoughts with a small dash or dot instead. Remember, there’s no “right” answer.
3
What might happen
Next, we think creatively about what this trend might catalyze. What could come about because of this trend? This (in our opinion) is the funner part of trend analysis because it’s where you get to flex your creativity and imagination. Jot down anything that comes to mind, however inconsequential or silly you may think it is. Give the time and space to others to add their thoughts.
Think full spectrum: Sometimes a trend can catalyze change that can be both good and bad. Don’t fret too much if you don’t know which side to write it down - what’s most important is that the implication is logged. You’ll find that most positive implications will have some negative side to them as well, with the reverse ringing true (negative implications carrying some positives as well).
Think in magnitudes: What might happen if this trend was but a small ripple? What could happen if it was to become fully mainstream? When writing down implications, state your assumption about the magnitude or strength of the trend. — This can lead you to list implications in a sort of timeline of magnitude, from when the trend is but a small ripple, to when it becomes fully mainstream.
Think of behaviours: Take some time to imagine how our behaviour might change when faced with this trend. Think of implications to personal life and values as well.
Imagine POVs of different actors: A useful frame is to ask yourself how different people/stakeholders/actors might experience this trend.
Document questions: Don’t forget to jot down any questions that pop up as a result of the analysis. Are there any uncertainties that are manifesting themselves? Anything that could flip either way?
4
What might be created
Now, this part of the trend analysis overlaps with implications, but here we like to wrap up our trend analysis by specifically calling out design implications for future services, experiences, products, and spaces that could be created as a result of this trend. This is the part that outlines ‘what could be exciting’ for future developments.
New jobs: Are there new jobs or business roles that could be created? Scan your list of implications to get thinking about new types of jobs that would be required to support or monitor those changes.
New businesses: What types of new companies could exist thanks to this trend? Private and public sector.
New products, services: Think about shopping in the future. Is there a new type of device or piece of hardware that is a likely output of this trend gaining importance? What might people be buying/owning?
Mitigators: What might need to exist to counter the trend? Is there anything we’d need to create to help control it? Something like a policy, a device, or a system?
What might be uncreated: Destruction or disappearance of present-day systems. What might be gone?
Key takeaways: Include a section for overall key insights that you want to make sure are highlighted when thinking about this trend. If you don’t have time to fully review your analysis at least you can read this section and get the high level view of it.
To sum it all up
What did we learn? Trend analysis is an activity you should do after your horizon scanning exercise to get a full spectrum view of a trends’ implications. It can be done individually, but is best done in teams. Ideally, smaller groups of 3-5 can take turns analyzing trend sets. There are different variations of trend analysis that can be done, from quick and dirty analyses to in-depth looks at possibilities so it’s important to structure your sessions according to your project’s needs!
There are no hard rules to trend analysis, if anything it’s more of an art form than a science. Have fun with it, think creatively, and build off each other’s perspectives.
And now for your freebie! Here’s our one-pager that includes sections for all of the pieces mentioned above. Try it out in your next session or recreate it digitally for your next workshop. Cheers!
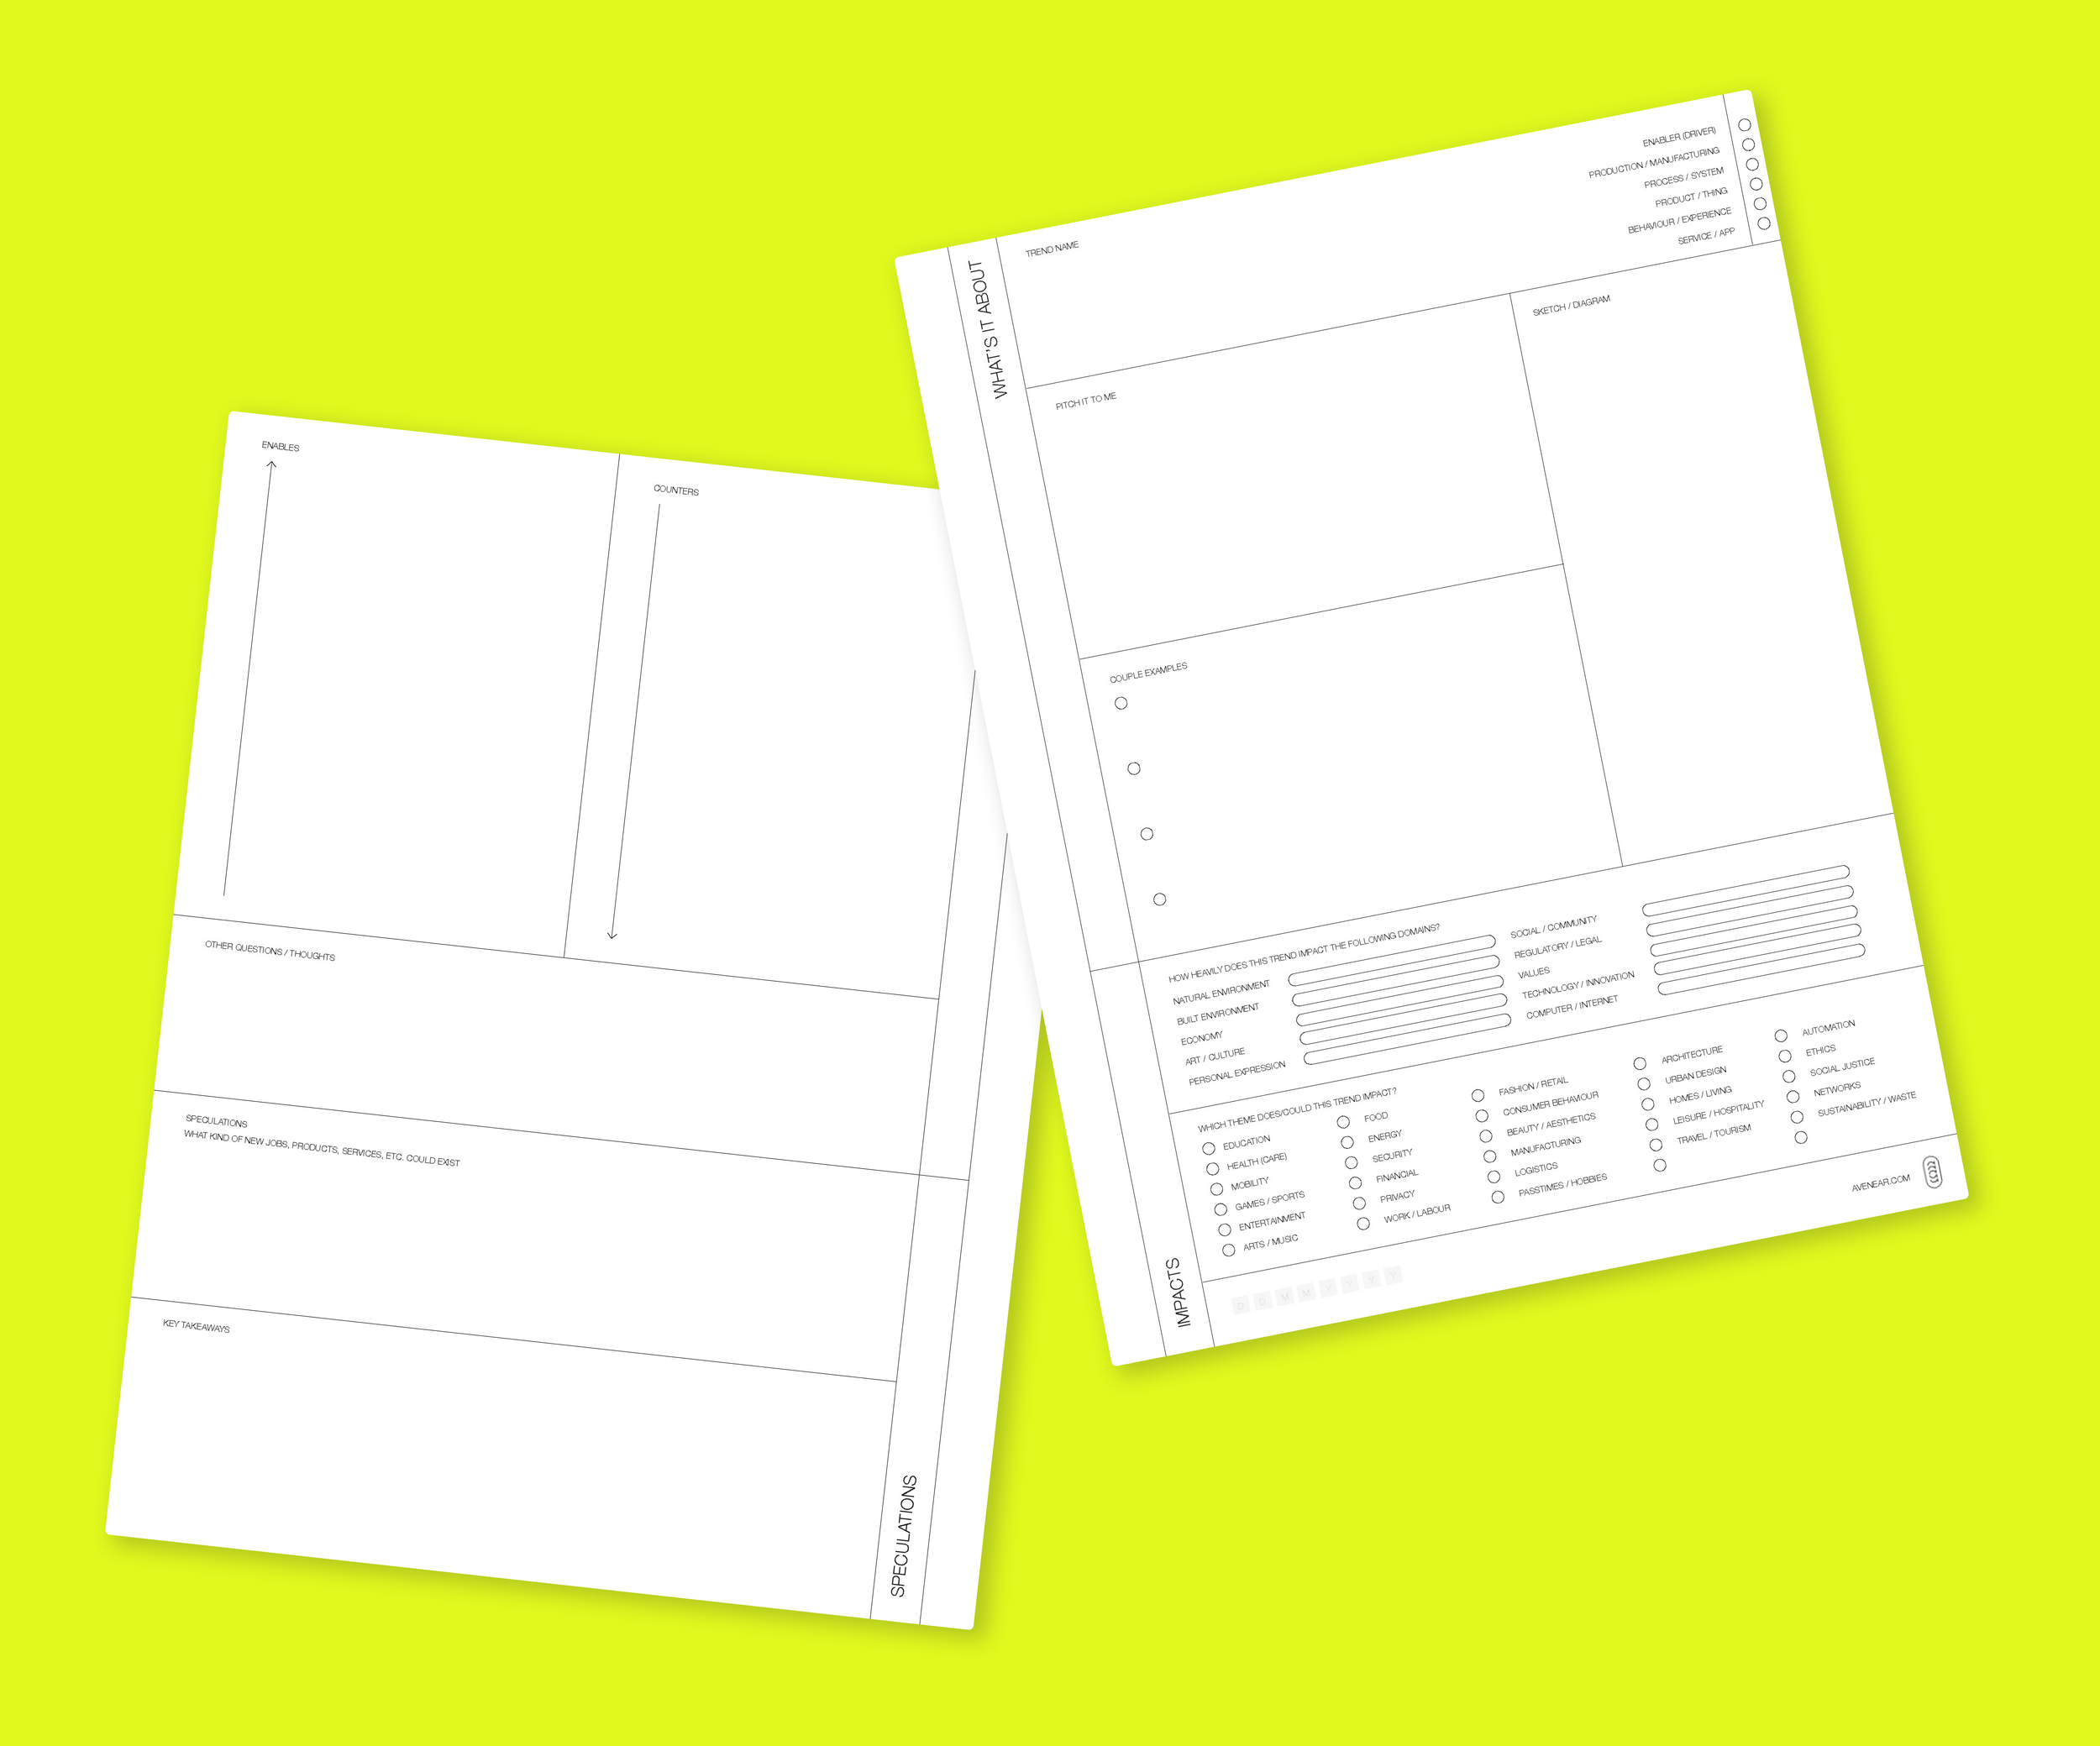
So now that you’ve made it to the end, here’s a handy dandy template to help you collect and analyze trends. It’s a one page summary of a trend that includes sections for describing the trend in question, analyzing impacts, and finally - listing out a couple top of mind implications.
Print a couple and organize them in a binder.
Use them in a workshop.
Double sided B&W print on letter sized paper